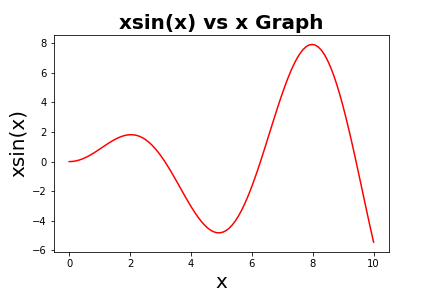
2D plot
First, We need to import the required modules for plotting. We write import numpy as np for including numerical python (numpy) package. Here we have shortened numpy as np which is the common short name. You can go with import numpy and for this case np will be replaced with numpy. Next we import matplotlib.pyplot package for plotting.
Lines [4-5] for calculating data points. np.linspace() is a function that takes three arguments, first argument is the initial point, the second one for the final point, and third argument responsible for the no of data points equally spaced between initial and final points.
plt.plot() function needs at least two arguments for two data points.
Lines [7-11] are for decorating the plot.
import numpy as np
import matplotlib.pyplot as plt

x = np.linspace(0,10,100)
y = x*np.sin(x)

plt.plot(x,y,"r")
plt.xlabel('x',fontsize=20)
plt.ylabel("xsin(x)",fontsize=20)
plt.title("xsin(x) vs x Graph",fontsize=20,weight="bold")
plt.savefig("2d-plot.png")
plt.show()
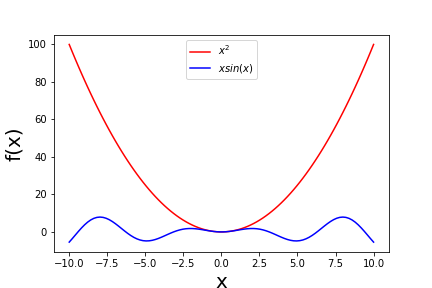
Multi plot
import numpy as np
import matplotlib.pyplot as plt
x = np.linspace(-10,10,100)
y1 = x**2
y2 = x*np.sin(x)

plt.plot(x,y1,'r',label=r"$x^2$")
plt.plot(x,y2,'b',label=r"$xsin(x)$")

plt.xlabel("x",fontsize=20)
plt.ylabel("f(x)",fontsize=20)
plt.legend(loc="best")
plt.savefig("demo2.png")
plt.show()
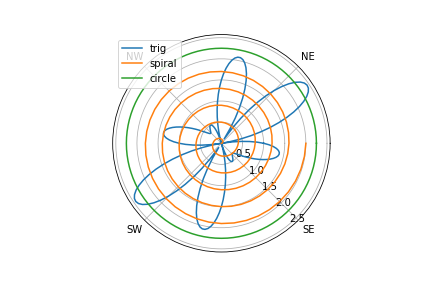
Polar plot
import numpy as np
import matplotlib.pyplot as plt
pi=np.pi
theta = np.linspace(0,2*pi,201)
r1 = np.abs(np.cos(5.0*theta)-1.5*np.sin(3.0*theta))
r2 = theta/pi
r3 = 2.25*np.ones_like(theta)
plt.ion()

plt.polar(theta,r1,label='trig')
plt.polar(5*theta,r2,label='spiral')
plt.polar(theta,r3,label='circle')

plt.thetagrids(np.arange(45,360,90),('NE','NW','SW','SE'))
plt.rgrids((0.5,1.0,1.5,2.0,2.5),angle=310)
plt.legend(loc='best')
plt.savefig("polar-plot.png")
plt.show()
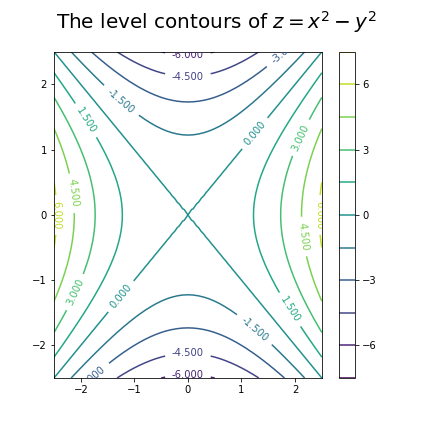
Contour plot
import numpy as np
import matplotlib.pyplot as plt
import matplotlib.cm as cm

[X,Y] = np.mgrid[-2.5:2.5:51j,-2.5:2.5:61j]
Z = X**2 - Y**2

curves=plt.contour(X,Y,Z,10)
plt.colorbar()
plt.clabel(curves)

plt.suptitle(r'The level contours of $z=x^2-y^2$',fontsize=20)
plt.show()
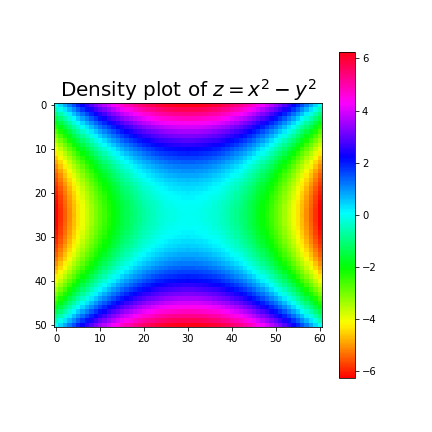
Density plot
import numpy as np
import matplotlib.pyplot as plt
import matplotlib.cm as cm

plt.ion()
[X,Y] = np.mgrid[-2.5:2.5:51j,-2.5:2.5:61j]
Z = X**2 - Y**2

plt.figure()
plt.imshow(Z,cmap=cm.hsv)
plt.colorbar()
plt.title(r'Density plot of $z=x^2-y^2$',fontsize=20)
plt.show()
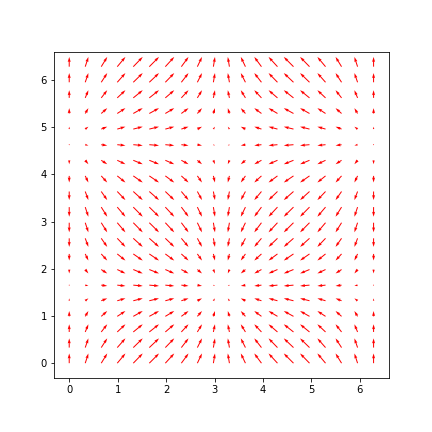
Vector plot
import numpy as np
import matplotlib.pyplot as plt
from pylab import rcParams
rcParams['figure.figsize'] = 6,6

x,y = np.meshgrid(np.linspace(0,2*np.pi,20),np.linspace(0,2*np.pi,20))
u = np.sin(x)
v = np.cos(y)

plt.streamplot(x,y,u,v)
plt.show()
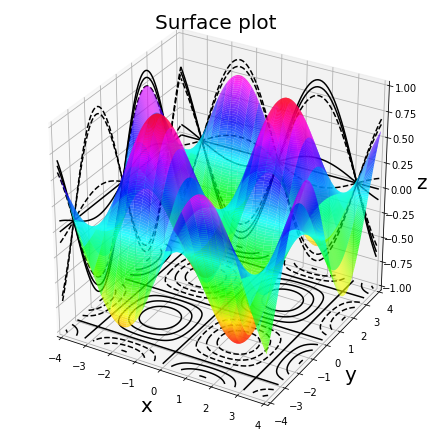
3D surface plot
import matplotlib.pyplot as plt
import numpy as np
from mpl_toolkits.mplot3d import Axes3D
import matplotlib.cm as cm
plt.ion()
fig = plt.figure()
ax = Axes3D(fig)
[x,y] = np.mgrid[-4:4:101j,-4:4:1011j]
z = np.sin(x)*np.sin(y)
ax.plot_surface(x,y,z,rstride=4,cstride=3,color='c',alpha=0.8,cmap=cm.hsv)
ax.contour(x,y,z,zdir='x',offset=-4,colors='black')
ax.contour(x,y,z,zdir='y',offset=4,colors='black')
ax.contour(x,y,z,zdir='z',offset=-1,colors='black')
ax.set_xlabel("x",fontsize=20)
ax.set_ylabel("y",fontsize=20)
ax.set_zlabel("z",fontsize=20)
ax.set_xlim3d(-4,4)
ax.set_ylim3d(-4,4)
ax.set_zlim3d(-1,1)
ax.set_title("Surface plot",fontsize=20)
plt.savefig("demo11.png")
plt.show()
